
In 2020, the world of work changed overnight. Millions of employees traded in their morning commutes for home offices or even their dining tables. This new way of working has become the norm for many American office workers, from rural mountains to city centers.
Fast forward to 2025, and the pendulum is swinging back—many companies are pushing for a return to in-office work, citing collaboration, culture-building, and the sunk costs of leased office spaces, among other reasons.
For employees, that shift doesn’t just mean giving up flexible schedules or casual work attire. It also means an additional financial hit as they face rising commuting costs. Gas prices are unpredictable, toll fees are unavoidable in many cities, and every mile driven adds wear and tear to your vehicle—leading to costly repairs. Many commuters don’t have reliable public transportation alternatives, making driving a necessity rather than a choice.
But beyond the direct costs, long commutes come with hidden financial risks—from increased accident exposure and rising insurance premiums to the opportunity cost of lost time. Suddenly, heading back to the office isn’t just about adjusting to in-person meetings—it’s about budgeting for an expensive return to the road.
So, how much does it actually cost to drive to work in 2025?
We analyzed key commuting expenses across U.S. cities—factoring in fuel efficiency, daily miles driven, local gas prices, repair costs, and toll fees. Adding up these costs over a full year reveals where commuting is the biggest financial strain, showing just how much drivers are paying to get to work.
Key Findings
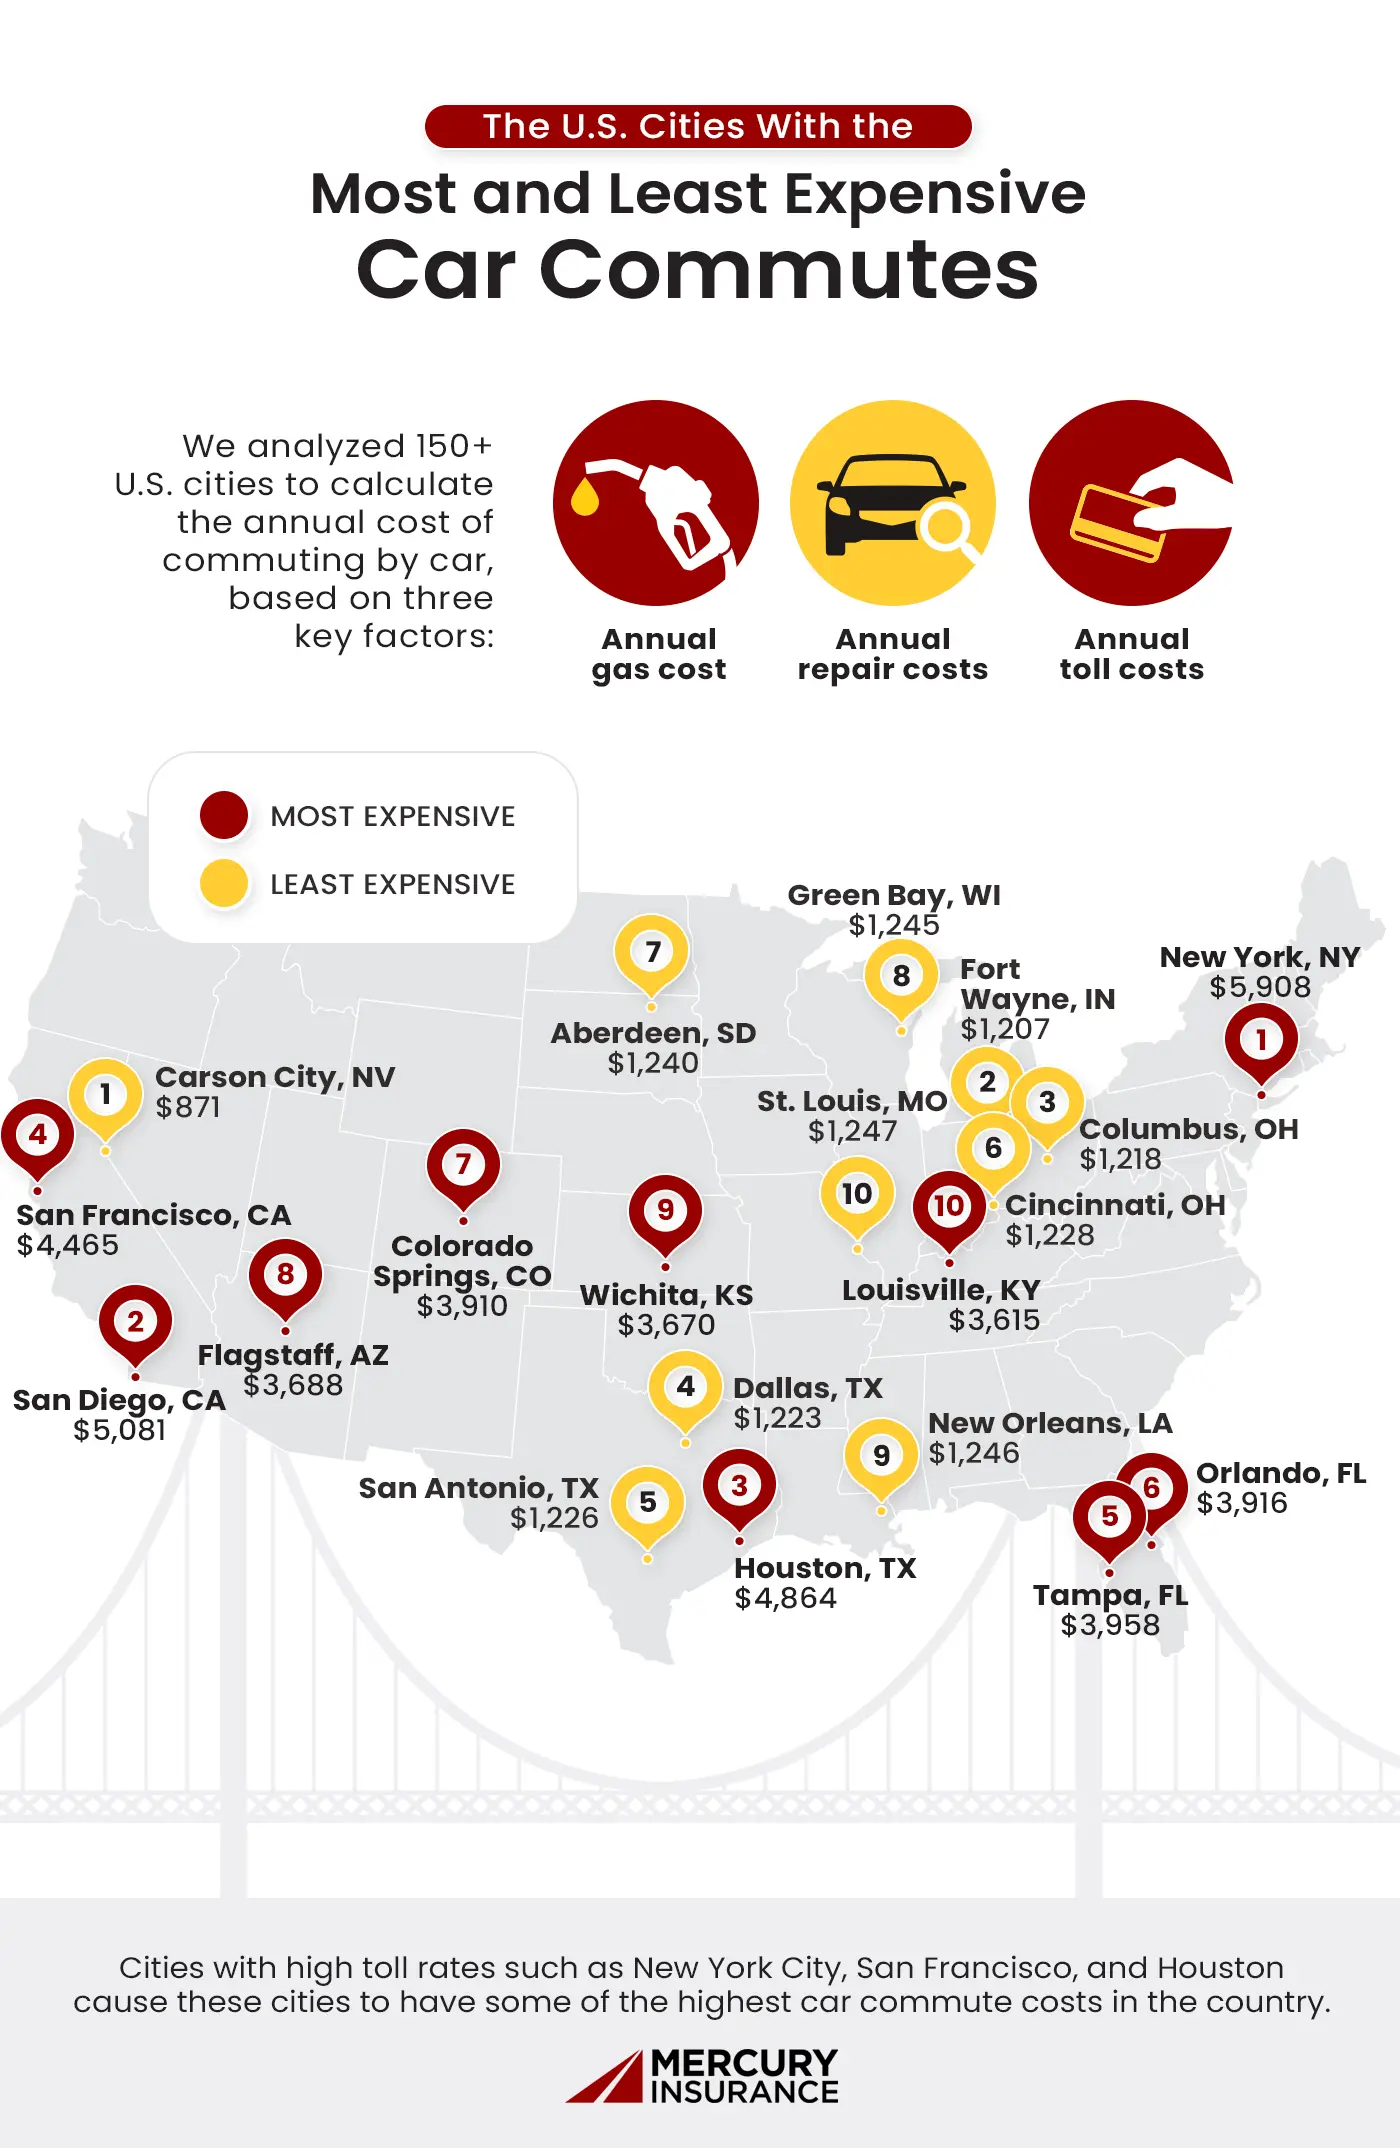
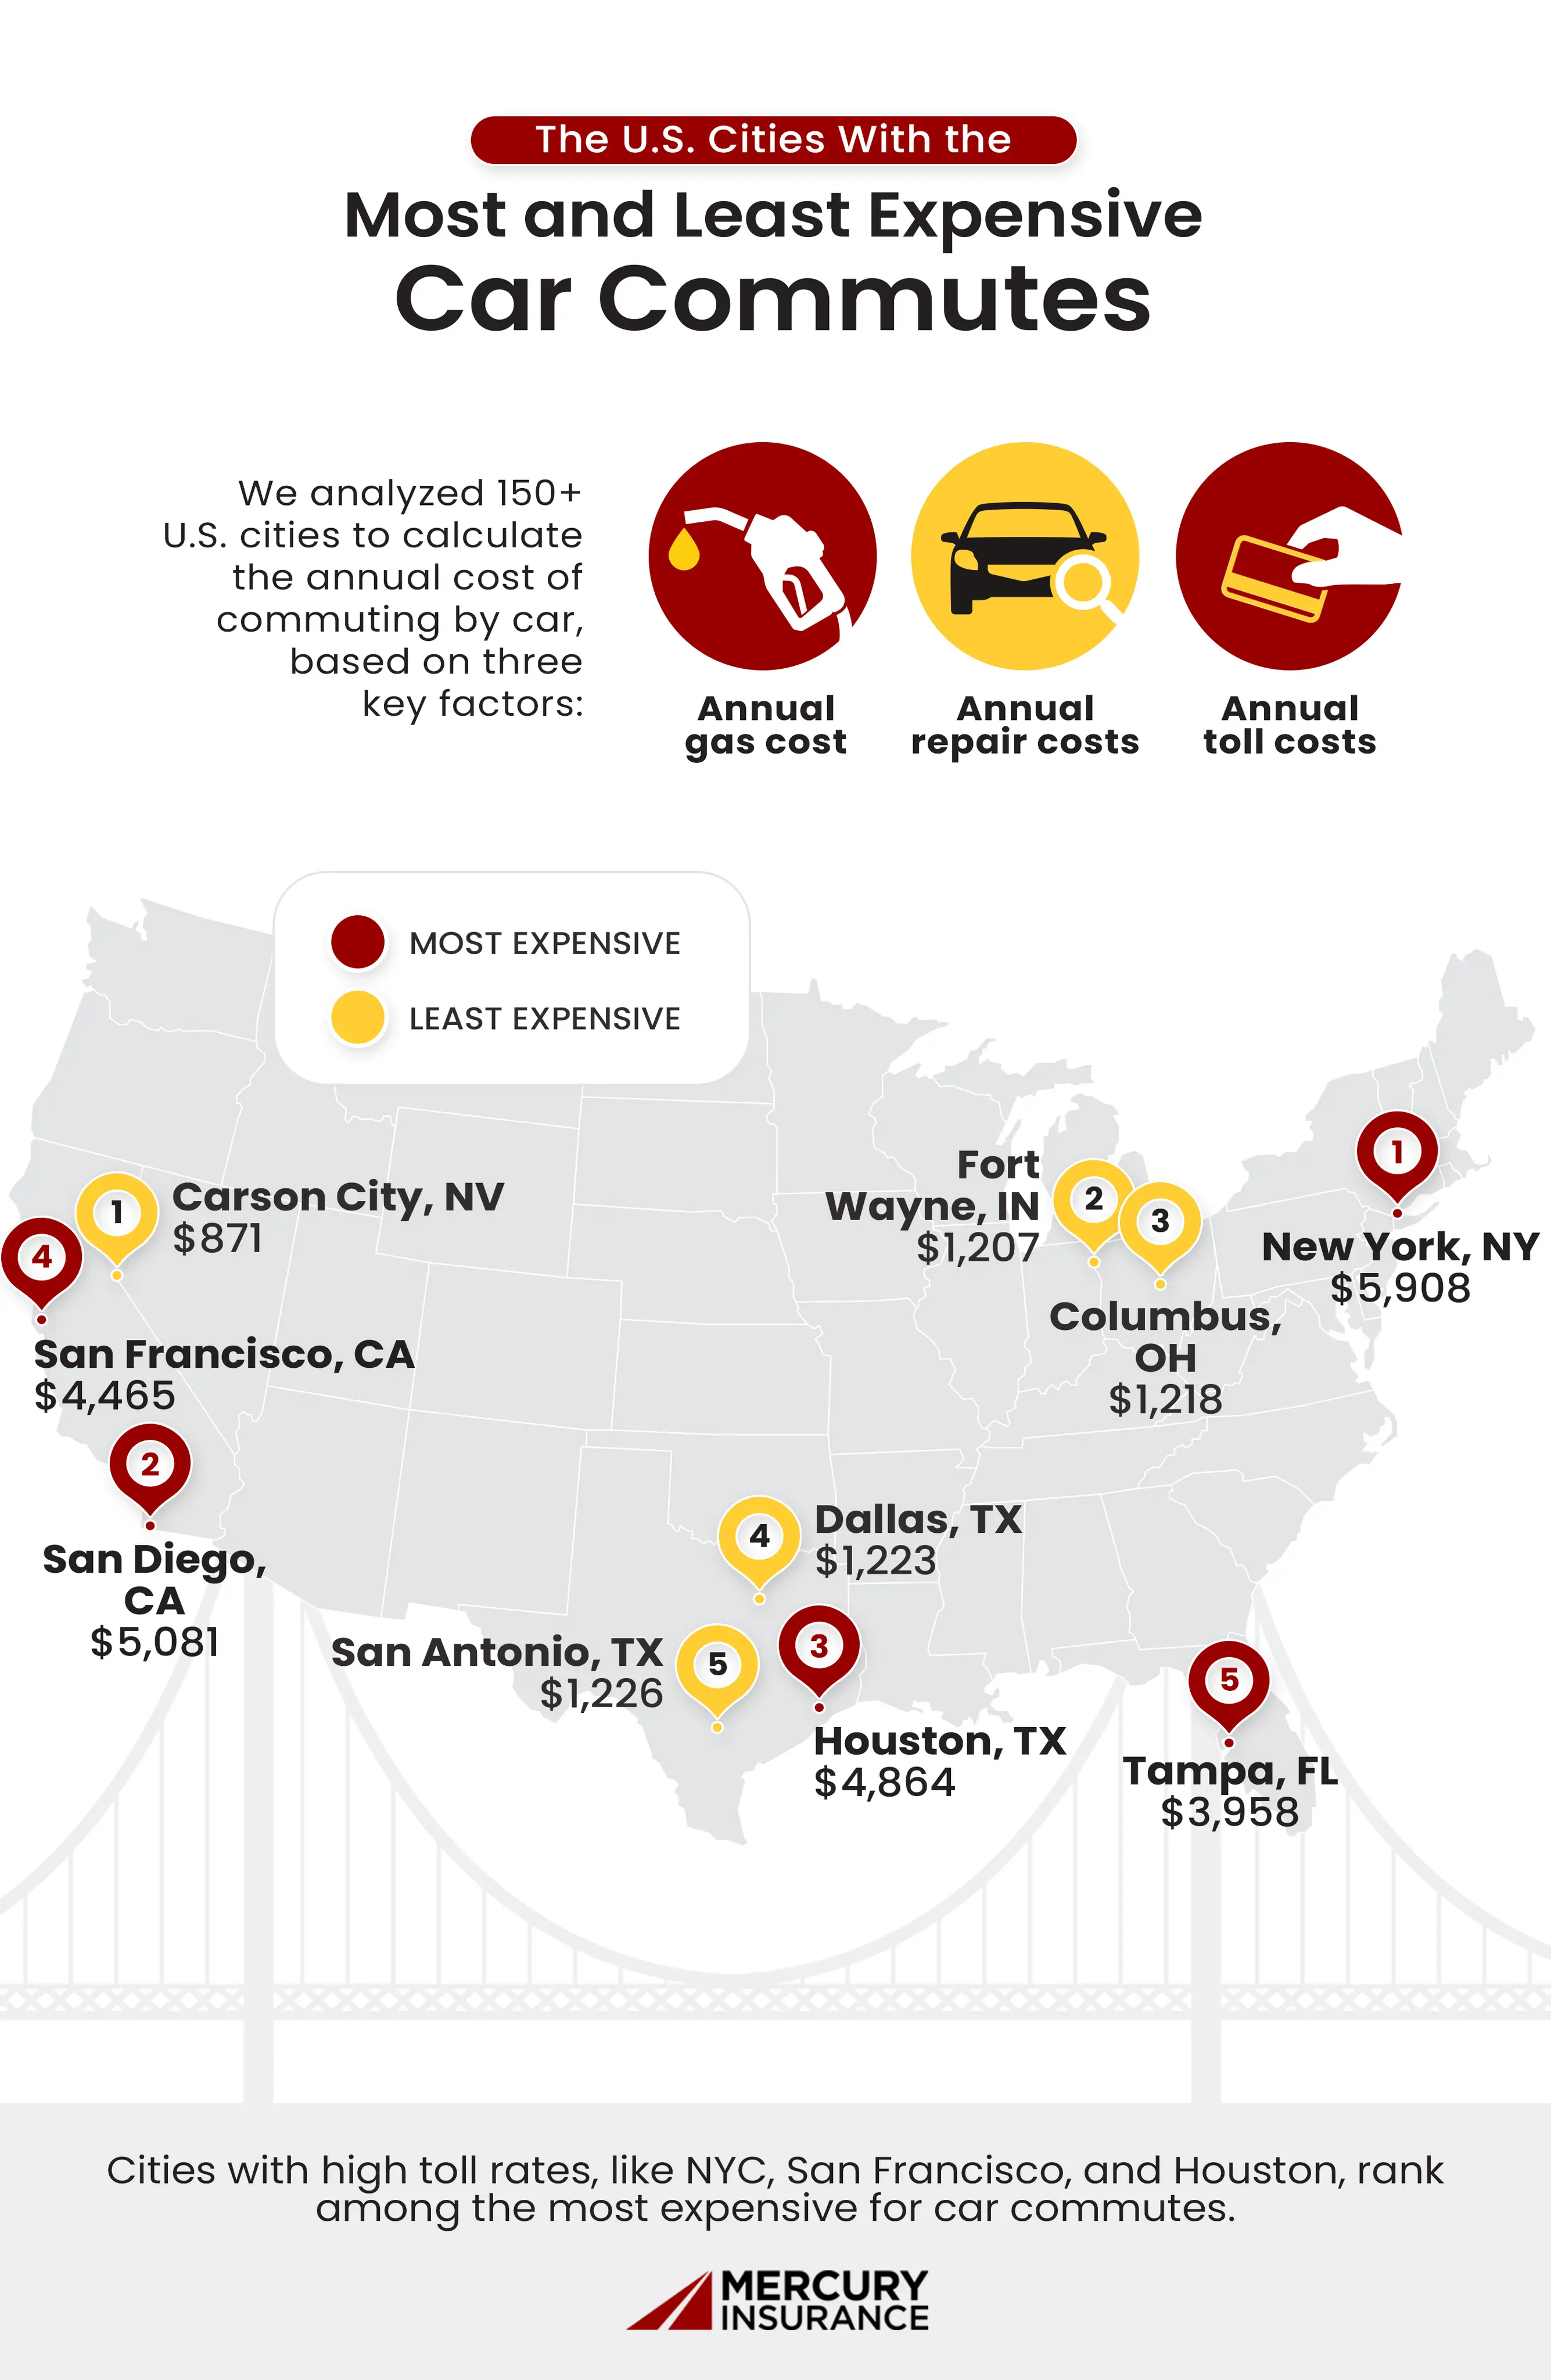
- New York, NY is the most expensive city for car commuters, with an average annual cost of $5,907. NYC also leads the nation in annual toll costs, averaging $4,680 per commuter.
- Stamford, CT, and San Francisco, CA have the highest opportunity costs of commuting—workers in these cities lose out on $18,649 and $17,267 per year, respectively, in potential earnings due to time spent commuting.
- Hilo, HI, Rutland, VT, and Orlando, FL have the highest commuting burdens relative to income, with commuters in these cities spending an average of 7% of their annual earnings just to get to work.
California Key Findings
- San Diego is the most expensive city for car commuters in California, with an annual cost of $5,080 (6.42% of their annual income). San Diego leads California in repair costs ($1,217/year) and fuel expenses ($1,653/year).
- San Francisco workers face the highest opportunity cost—$17,267 in lost earnings per year due to time spent commuting. San Francisco also has the highest toll costs at $2,860 per year for the average commuter.
Americans are spending thousands of dollars a year to drive to work. Here’s where commuters are spending the most annually.
As cities expand and infrastructure evolves, the cost of commuting continues to shift, and it’s hitting some commuters harder than others. Here are a few cities where our research found commuting costs the most:
New York City
(#1) $5,908 annual commuter cost
New York City remains the most expensive city for commuters, with drivers spending nearly $6,000 per year on gas, tolls, and vehicle maintenance. With recent toll hikes on the Holland and Lincoln Tunnels, plus an ongoing debate over congestion pricing, NYC drivers are facing a growing financial strain just to enter Manhattan.
San Diego
(#2) $5,801 annual commuter cost
In San Diego, where traffic congestion and high gas prices burden daily commuters, the cost of commuting continues to climb. With fuel prices among the highest in the nation– sixth highest, according to our data collection– San Diego drivers face mounting expenses just to get to work.
Houston
(#3) $4,864 annual commuter cost
In Houston, where drivers routinely face long commutes and high toll costs, fares on the Sam Houston Tollway now range from $12 to $14 per trip. These rising expenses add to the challenge of navigating one of the country’s most traffic-heavy metro areas.
Overall, tolls are one of the biggest contributors to rising commute costs; the fourth most expensive city, San Francisco, could be seeing tolls as high as $11.50 by 2030 further increasing their already high commute costs.
At the other end of the spectrum, Carson City, Nevada, remains the cheapest place to commute, with low gas prices, minimal tolls, and commuters spending just 1.37% of their income on getting to work—the lowest in the nation.
Where Workers Spend the Most and Least of Their Income on Getting to Work
In some places, getting to work isn’t just an inconvenience—it’s a major financial strain. Hilo, HI, tops the list of cities spending the highest percentage of its income on commuting, with workers spending a staggering 7.54% of their income on travel. Rutland, VT (7.20%) and Orlando, FL (6.77%) aren’t far behind, showing that smaller cities aren’t immune to high commuting costs.
Carson City, NV, ranks as the most affordable, with commuters spending just 1.37% of their income on transportation. Stamford, CT (1.38%), Fayetteville, AR (1.43%), and San Jose, CA (1.47%) also rank low—thanks to higher wages that help offset commuting costs. But don’t be fooled by Stamford’s affordability—workers here are still losing out on an estimated $18,649 per year in potential wages due to time spent in traffic.
Time is money, and commuters are losing both.
Beyond gas, tolls, and maintenance, commuting has a hidden cost—lost time that could have been spent earning money. When workers are stuck in traffic, they’re not just burning fuel—they’re losing potential wages.
Nowhere is this felt more than in Stamford, CT, where long commutes translate to $18,649 in lost earnings per year. That’s money workers could be putting toward housing, savings, or even cutting back their work hours—if only they weren’t spending so much time behind the wheel.
Even in smaller cities, the lost wages add up. In Rutland, VT, commuters miss out on $3,239 per year, a significant hit in an area where wages tend to be lower.
Discover how much it costs to commute in your city
If you’re one of those remote employees who’ve been called back to the office, you’ll want to keep opportunity costs, commuting factors, and income percentages in mind before you make the investment into commuting to and from your job. That all boils down to one question: Is it worth it to you? Explore the interactive table below to determine how much it costs to commute in your city.
Wondering how your state stacks up when it comes to commute prices? Our research looked at the most expensive and cheapest car commutes in your state:
Methodology
To calculate the average annual commute cost we:
- Calculated the average annual gas cost:
- Divided the average number of daily miles driven from Axios, by 26.4 (the average gas mileage of a car) to determine the number of gallons used daily.
- Multiplied this number of 260 (the average number of working days in a year) to find the total number of gallons used per year.
- Multiplied this number by the average gas price from GasBuddy, to get the total cost spent on gas per year.
- Calculated the average annual repair cost:
- Used CarMD’s Vehicle Health Index to find the difference in each state’s repair cost per mile driven from the national average (9.68 cents per mile).
- Multiplied each city’s cents per mile driven by the annual number of miles driven to determine how much they might spend on repairs caused specifically from the wear and tear of commuting.
- Calculated the average toll cost:
- Found the average toll amount for commutes in each city from Toll Guru
- Multiplied the average toll amount for commutes by two to represent coming to and from work, and then by 260 to represent each work day.
- Added all numbers together to find the total annual commute cost.
To calculate the average opportunity cost:
- Calculated the average minute wage by city, by taking the BEA’s median income by county and dividing it by 124,800.
- Multiplied the minute wage by city with the average amount of time spent commuting from the U.S. Census Bureau.
Lower Your Commute Costs With Affordable Auto Insurance
With commuting expenses rising, every dollar matters. While gas, tolls, and maintenance costs may be unavoidable, high auto insurance rates don’t have to be. Mercury provides competitive car insurance quotes to help keep your total commuting costs in check—without compromising on coverage.

The Mercury Marketing Team is made up of professionals in the fields of Content Creation, Public Relations, Social Media and Journalism. The team works together to deliver professionally written and researched content to provide information for consumers.